Hubble Tuning Fork Project (HTF)
Introduction
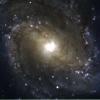 Galaxies are huge collections of stars, gas and dust held together by gravity. Our Galaxy, the Milky Way, is known as a spiral galaxy as it has spiral arms that wind their way around the centre of the galaxy (or bulge).
The first galaxies were identified as far back as the 17th Century by a French Astronomer called Charles Messier. Messier compiled a list of 110 star clusters and spiral nebulae which he discovered whilst searching the sky for comets. It wasn't until the early 20th century however that the nature of the spiral objects was determined - before this, astronomers were divided in whether these spiral objects were clouds of gas in our own Galaxy, or separate galaxies outside of the Milky Way.
In the 1920's Edwin Hubble measured the distance to one of these spiral objects (the Andromeda galaxy), and proved that it was in fact located outside of our own Galaxy. He then introduced a way of classifying them according to their appearance and illustrated his classification scheme with his famous ʻtuning fork diagram'.
We now know that Hubble's tuning fork diagram breaks down at higher redshifts - the numbers of spiral and barred spiral galaxies decrease with increasing redshift, and the number of peculiar looking galaxies increases. This is due to the galaxy interactions taking place at higher redshifts, forming larger galaxies out of the smaller ones.
In this project you will use data taken with the Faulkes Telescopes, to produce colour images of galaxies of different types at low redshifts, and create a FT tuning fork diagram.
Below are the documents and data files which you will need to carry out this project - start by downloading and reading through the 'Hubble Tuning Fork Project Instructions' document, then follow the instructions for downloading or taking your own images to produce a tuning fork diagram.
Documents
HTF - Project Instructions< (.pdf)
HTF - Background Information< (.pdf)
HTF - Galaxy List< (.pdf)
HTF - Galaxy Types< (.xls)
HTF - Template of Hubble Tuning Fork Diagram< (.jpg)
Data files
HTF data archive BVR <(.zip file 74.3Mb)