Resources
 Welcome to the National Redshift Project activities page. On this page you will find links to a number of redshift-based activities. Some of the activities are more involved and include using the robotic Faulkes Telescopes to obtain your own data, whereas other activities make use of archive data and other web-based resources. A brief decsription and links to the activities are given below.
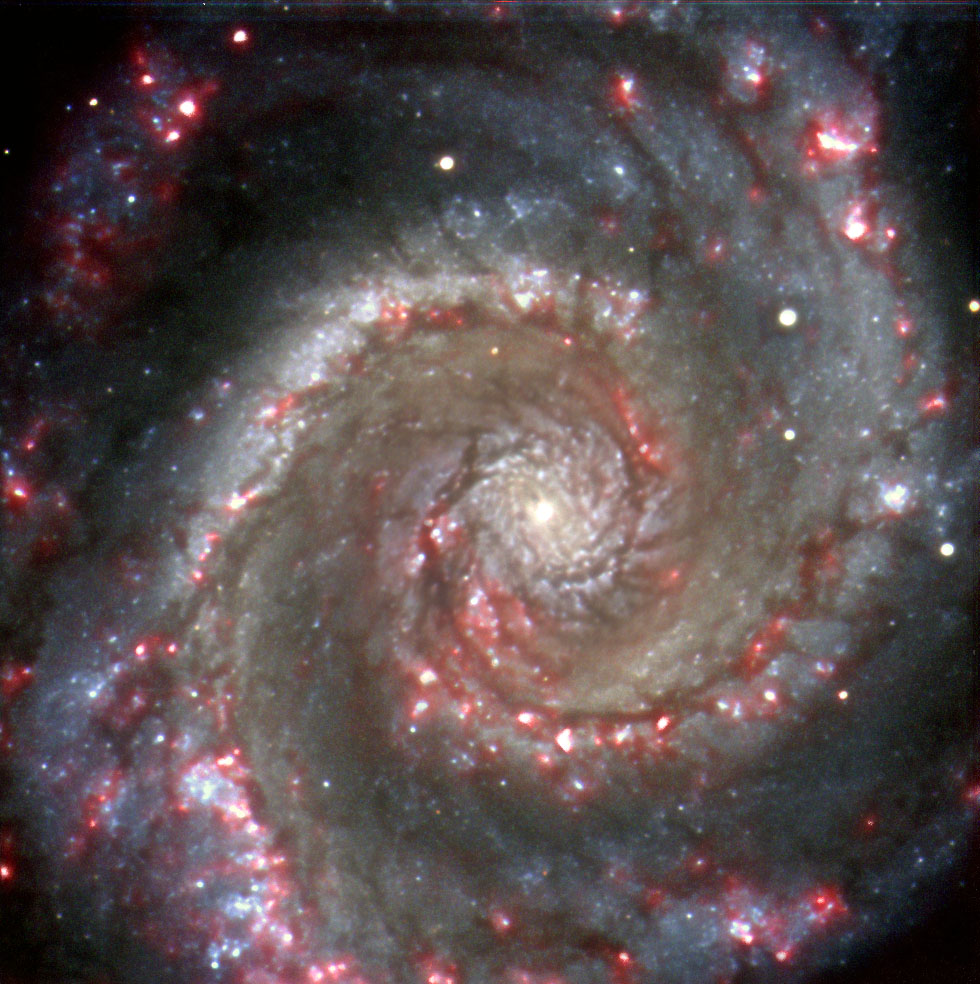
In the 1920's, Edwin Hubble, after proving that other galaxies were located outside of our own Galaxy, introduced a way of classifying galaxies according to their appearance and illustrated his classification scheme with his famous ʻtuning fork diagram'.
We now know that at high redshifts, this tuning fork diagram breaks down, but is a good method of classifying galaxies up to redhsifts of about 0.5, corresponding to a time when the Universe was about 8.6 billion years old.
In this project you will use data taken with the Faulkes Telescopes, to produce colour images of galaxies of different types at low redshifts, and create your own FT tuning fork diagram.
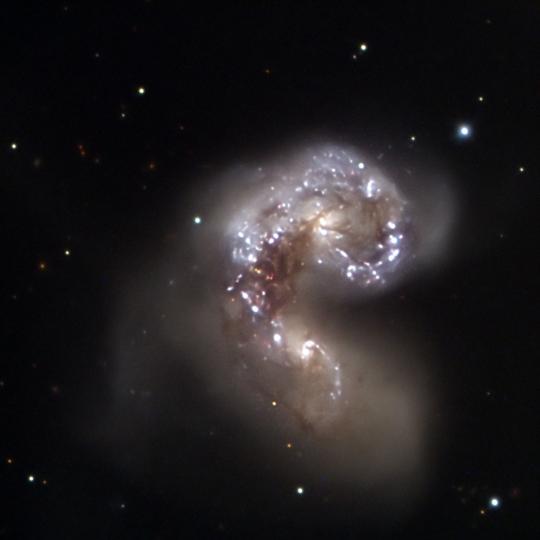
The generally accepted model for structure formation in the Universe present is that smaller objects formed first in the Universe, at redshifts greater than about 6 (corresponding to when the Universe was younger than about 900 million years) and that through a series of mergers, began forming the larger galaxies which we see today. Observations of interacting galaxies give a snap-shot in time of collisions which actually last billions of years. By using computer simulations to model these interactions, astronomers can look into the past and the future of these encounters and look at how structure formed in the Universe.
In this project you will use the Java applet applet, 'Galaxy Crash' (written by Chris Mihos, Case Western University, USA - http://burro.astr.cwru.edu/JavaLab/<), to simulate interactions of galaxies. You will create tidal tails and elliptical galaxies, and reproduce the types of galaxy interactions which we observe at lower redshifts today.
Hubble's Law<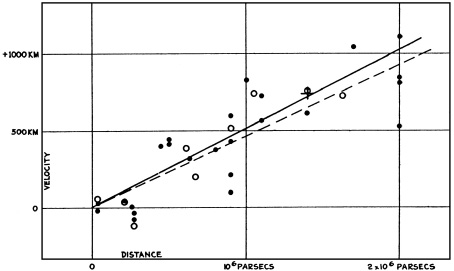
In 1923 Hubble was studying novae in M31 (now known as the Andromeda Galaxy), when he realised that one of the objects he was observing was in fact a Cepheid variable. Earlier that century, a female astronomer, Henrietta Leavitt, discovered a relation between the period of Cepheid variables and their luminosity, which allowed their distances to be calculated. Hubble studied galaxy distances using Cepheids as his measuring tool, and in 1929 published his results. His plot of the velocity of galaxies vs. their distance showed that most galaxies are moving away from us, and the further away they are, the faster they are moving. This became known as Hubble's Law.
In this activity you will use Hubble's original data from 1929 to find a value for Hubble's constant and calculate the age of the Universe. You will then use more recent data to plot your own Hubble diagram, and find more accurate values for these.
Recent research suggest that more than half the stars we know about exist in multiple star systems, with a large fraction of these being 2 star, or binary systems. These systems are held together by gravity, and are important as their masses can be determined from observations of their orbits. By extrapolating these results, the masses of single stars can then be estimated.
SS433 is a binary star system which consists of a massive, hot star anda compact object (a small, dense object at the end of a starʼs life,such as a neutron star or black hole), orbiting around a common centreof mass. As material falls from the star to the compact object, a disk forms, and jets of material are ejected at 90 degrees to the disc.
In this activity you will calculate the red and blue shifts of these jets and work out how long it takes them to reach the edge of the supernova remnant, W50.